Overhead Cost Benchmarks for Independent Tax Firms
Most firm owners benchmark overhead against the wrong measurement without realizing it.
Overhead in an independent tax firm is several numbers, each measured against a different baseline, and most firm owners are comparing their costs to the wrong one without realizing it. It's several numbers, each measured against a different baseline, and most firm owners are comparing their costs to the wrong one without realizing it. Practitioners across the profession track every expense line diligently but still can't say with confidence whether their overhead is high, low, or normal for a firm their size.
The revenue distribution of independent firms, and why size tier determines the benchmark that applies
Start with where independent firms actually sit on the revenue scale, because it's not where most people assume. The largest single group of respondents in recent industry surveys, 27%, reported annual revenue between $251,000 and $700,000. Another 20% or so landed in a band running from just above that tier up to roughly double the top of it. The typical independent tax firm is small to mid-sized when the figures are added up. It is not a large regional player with a sizable staff, and benchmarks built from large-firm data simply don't transfer down to this population without distortion.
Size doesn't just describe revenue. It dictates the entire cost structure. A solo practitioner with no employees, no lease, and a laptop running tax software has an overhead profile that shares almost nothing with a firm doing a couple of million dollars a year. Firms somewhere between a solid seven figures and several times that, generally 6 to 20 people, have started building actual infrastructure: admin staff, dedicated office space, a real technology stack. But they're often still bottlenecked by owner involvement in ways a larger firm has grown past.
Growth trends matter too. The 2025 MAP Survey put median revenue growth at 6.7% in fiscal 2024, a notable deceleration from the higher growth rates seen in recent prior periods. Growth hasn't stopped, but it's slowing, and that deceleration changes how much overhead a firm can reasonably absorb before margin erosion becomes a real problem instead of a rounding error. Once a firm knows which tier it belongs to, the benchmarks that follow stop being abstract and start working as a diagnostic tool.
Personnel costs: the dominant overhead driver that the 20–25% figure doesn't capture
The Rosenberg Survey, one of the most widely cited benchmarking sources in public accounting, defines overhead as every firm expense except salaries and benefits for professional and admin staff. Labor sits in its own separate bucket. Under that definition, the Rosenberg Survey puts overhead at 20% to 25% of revenue.
Firms that build their own internal definition by lumping labor in with everything else will report a number two or three times that size. Neither firm is wrong, exactly. They're just not measuring the same thing, and treating those two numbers as comparable is where most benchmarking conversations go wrong before they even start.
So if labor isn't in the 20 to 25% figure, where does it go? Almost entirely into its own line, and it's the biggest one on the page. For firms in the mid-sized revenue band, the Rosenberg Survey puts personnel costs at 45% to 55% of revenue. Labor is the largest cost a firm carries, and it isn't close: it dwarfs every other category combined.
Staffing mix inside that number matters too. The Rosenberg Survey puts admin personnel at around 20% of total headcount at a well-structured firm. On a 30-person firm, that's roughly six admin staff supporting the professional team. Firms that fall meaningfully below a 15% admin ratio are usually firms where partners have quietly absorbed admin work themselves, an absorption that is invisible on a P&L but drains partner capacity all the same.
Salary inflation is only tightening the squeeze. Median starting salaries for new bachelor's degree graduates rose almost 11% over a two-year stretch; for new master's graduates, the increase was 17%. Firms budgeting personnel costs off last year's numbers are already behind, and the ones that don't catch this will find their margin assumptions quietly obsolete by the time the annual review happens.
Occupancy and non-labor overhead: what 10–18% of revenue includes
For firms in that same mid-sized revenue tier, the Rosenberg Survey puts occupancy combined with general overhead at 10% to 18% of revenue. This is the number most independent firm owners should actually be using as their reference point, since it's built specifically to exclude labor and isolate everything else.
What lives inside it: rent, insurance, computer expenses, training, bad debt write-offs, marketing. A wide bucket, but a defined one, and every dollar spent on people is deliberately kept out.
There's a useful sanity check buried in the data: per-person overhead in the $35,000 to $45,000 range. A firm running well above that on a per-head basis should take a hard look at its non-labor spending, whether it's actually proportionate to its size, or whether it's carrying costs left over from an earlier, larger version of the firm.
Remote and hybrid work has changed the occupancy side of this equation for a lot of small firms, shrinking the square footage they need and, in some cases, killing the lease line. But there isn't a confirmed, isolated benchmark for occupancy-only costs separate from the broader 10 to 18% figure. Circumstances vary too much firm to firm for a single clean number to exist yet.
Technology spend: the 4–8% benchmark and why small firms systematically fall short of it
The standard benchmark for CPA firm technology spend is 4% to 8% of revenue. Treat that as the range to aim for, not a ceiling to avoid crossing.
The uncomfortable part is how unevenly that spending is actually distributed. Large practices allocate, on average, roughly 30 times what small firms spend on technology. Even mid-sized firms run a fraction of the technology budget of their larger counterparts, despite staffing levels that sit far closer to parity than that gap would suggest. Small firms aren't just spending less in absolute terms. They're underinvesting relative to their own size, and that gap compounds every year software becomes more central to how returns get produced.
Accounting Today's Year Ahead survey put technology at 21% of accounting firm budgets, with more than 60% of firms planning to increase IT spending further. That figure looks alarming next to the 4 to 8% benchmark until the methodology comes into view: the 21% figure appears to fold in labor and other costs under its definition of "budget," which makes it a different measurement, not one directly comparable to Rosenberg's overhead-only figure.
Spending inside the 4 to 8% range doesn't guarantee efficiency, either. The common failure modes are mundane and expensive: running duplicate document management systems because nobody sunset the old one, paying for desktop software licenses alongside a cloud subscription that does the same job, subscribing to a practice management platform that half the staff never logged into. Spend can sit squarely in benchmark and still be wasted.
Profitability benchmarks by firm size: what the numbers look like when costs are assembled correctly
Solo practitioners post the highest margins in the profession when they're run well: 55% to 65% among top performers. The cost structure explains why. No employees, no lease (or a home office at most), minimal technology overhead. Revenue is close to labor hours times billing rate, minus a small fixed-cost base, about as clean a margin structure as exists in the profession.
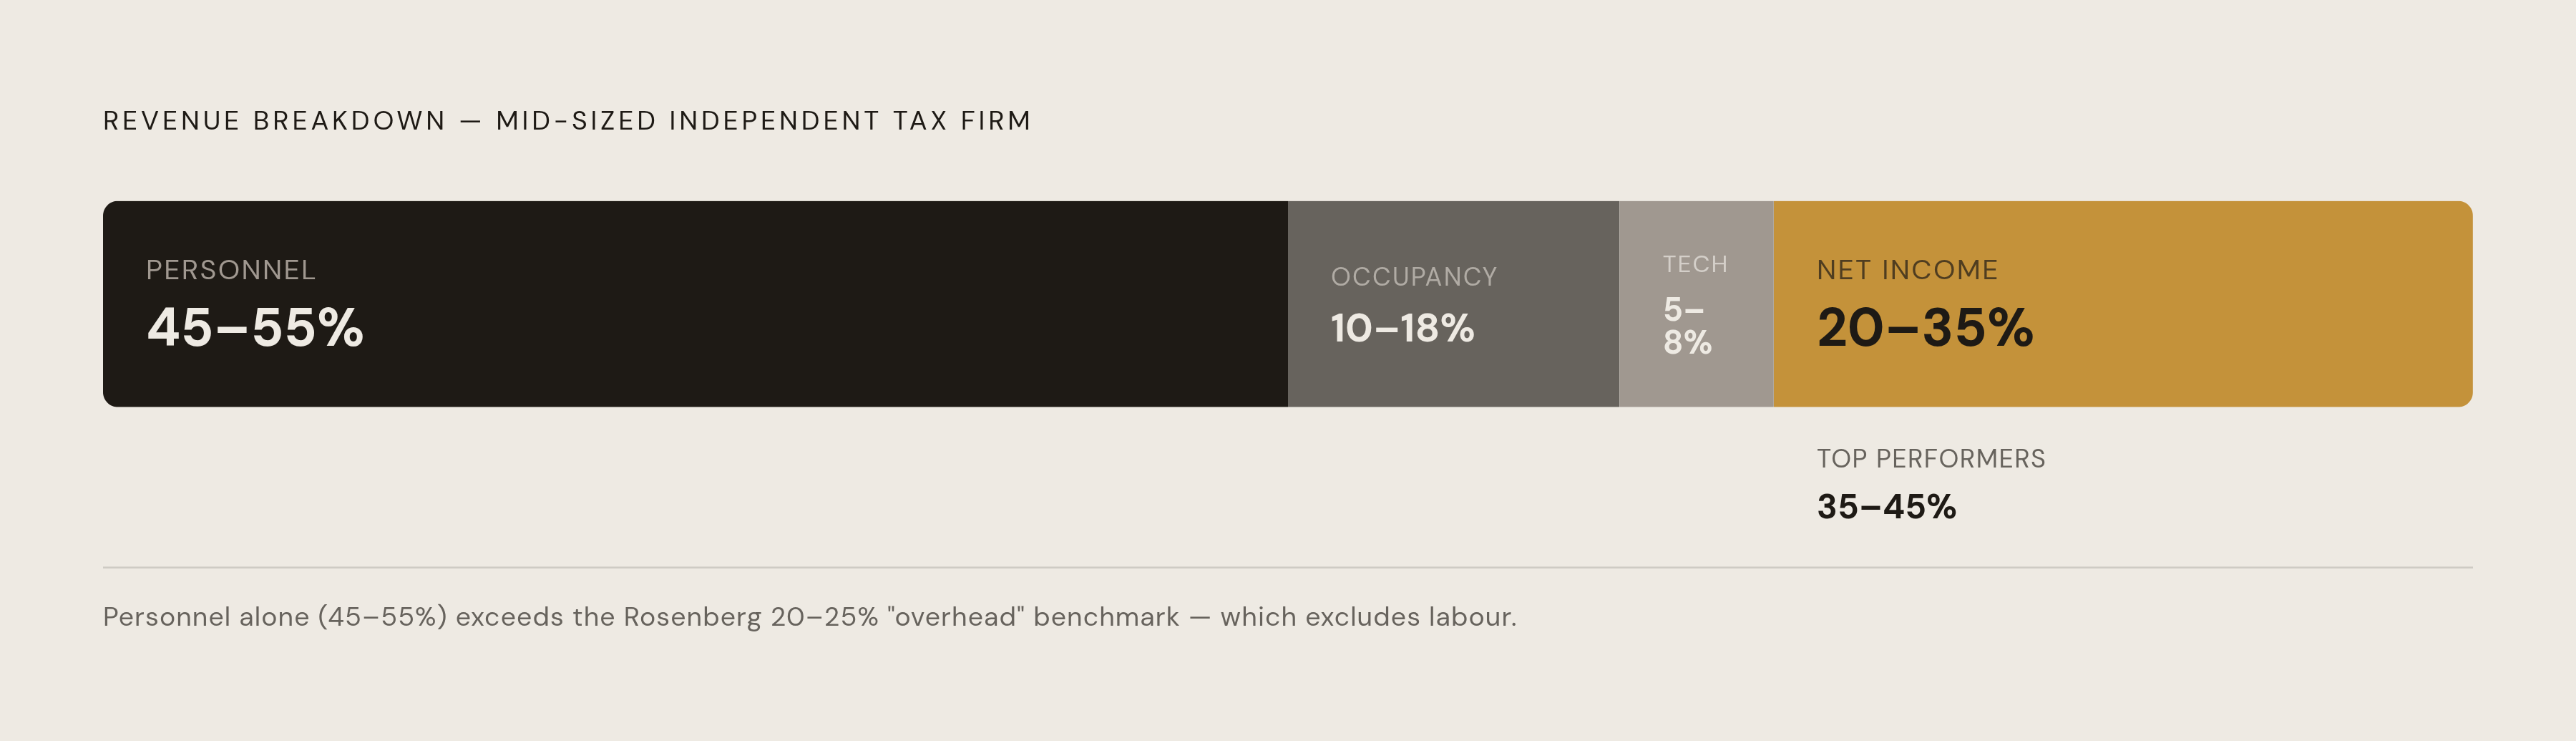
Small-to-mid firms in the mid-sized revenue range look different once the full stack is assembled: personnel at 45 to 55%, occupancy and overhead at 10 to 18%, technology at 5 to 8%. Add it up and net income is in the 20% to 35% range for a typical firm, with top performers reaching 35% to 45%.
Margins tend to face pressure as firms grow past the small-firm stage and begin building out infrastructure ahead of the revenue base that will eventually support it. The timing mismatch between adding capacity and growing into it is a common feature of the mid-sized firm stage.
Broader EBITDA benchmarks back this up from a different angle. Average accounting firms run 20% to 30% EBITDA margins. Well-managed firms reach 30% to 40%. Elite performers exceed 40%. The spread between average and elite is not a rounding error. A firm managing its cost structure on purpose reaches 30% to 40% or more, while one managing it by accident stays at 20% to 30%.
Efficiency metrics that give overhead ratios operational meaning
An overhead ratio by itself is a static number. It says nothing about whether a firm's cost structure is efficient, only whether it's large or small relative to revenue. The more useful approach pairs cost data against revenue productivity: revenue per staff member, the staff leverage ratio between professional staff and partners, utilization and realization rates, and profitability broken out by service line.
Billing rate spread is one of the starkest efficiency signals available. Top-quartile firms achieve net realized rates 66.8% higher than bottom-quartile firms: $482 versus $289. That's not a small edge, and it compounds across every billable hour a firm produces in a year.
Unbilled work is the overhead nobody labels as overhead. A 6% leakage rate, meaning work performed but never billed, translates to $30,000 to $36,000 lost on a $500,000 to $600,000 revenue base. It never appears on an expense report, because it functions as revenue that quietly failed to arrive rather than a cost incurred.
Fewer than a third of firms regularly benchmark their rates against competitors, relying instead on informal sources, word of mouth, or gut instinct. The firms that do benchmark systematically tend to price with more discipline, and pricing discipline shows up directly on the bottom line. Firms that measure their rates against the market price with more discipline, and pricing discipline shows up directly on the bottom line.
Rising fees currently offsetting overhead increases, and the limits of that strategy
The dominant response to rising costs right now is simple: raise fees. Roughly 80% of firms plan to increase fees heading into 2026, most in the 5% to 10% range, and 49% cite rising business costs directly as the reason.
Those increases have already been substantial, not incremental. The national average base charge for a Form 1040 with Schedules 1 through 3 rose 45.7% from 2023 to 2025. That's structural repricing that fundamentally overhauls the pricing model beyond an invoice's routine cost-of-living adjustment.
Business return pricing tells a similar story: business return pricing has followed a similar upward trajectory across entity types. Roughly 83% of tax professionals now raise fees every one to two years, typically by 6% to 10%. The profession has shifted from occasional repricing to a standing annual practice.
Fee increases can absorb overhead growth for a while. They can't absorb it indefinitely. Client tolerance sets a ceiling eventually, and a firm that has spent years raising prices instead of managing its cost structure runs out of room to keep doing both at once. The firms betting their whole margin strategy on next year's fee increase are postponing a conversation about cost structure that fee increases alone won't settle.
Translating benchmarks into a practical self-assessment for your firm
Settle how overhead is defined before comparing anything externally. That comes first, before any number gets pulled off a survey. If labor is folded into your internal "overhead" figure, the Rosenberg 20 to 25% benchmark is not the right comparison, and using it anyway will make a firm look far more efficient, or far worse, than it actually is.
Next, place the firm in its revenue tier and pull the matching benchmark set. Solo firms and those under $250,000 in revenue carry a high profitability ceiling, 55% to 65% for top performers, with overhead that's almost entirely non-labor fixed cost. Firms spanning from a modest six figures up to well into seven figures, the largest segment of the independent population, will find personnel cost is the dominant driver of their economics, and the $35,000 to $45,000 per-person overhead check is a fast first test of whether non-labor spending has gotten out of line. Firms in the mid-sized revenue range should use the full cost stack: personnel at 45 to 55%, occupancy and overhead at 10 to 18%, technology at 5 to 8%, benchmarked against net income of 20 to 35% (35 to 45% for top performers).
Run the leakage check next. A 6% unbilled work rate costs $30,000 to $36,000 on a $500,000 to $600,000 revenue base, and that's a real cost even though no line item captures it.
Finally, weigh technology spend against the 4 to 8% benchmark, and be honest about whether those dollars are actually working, or whether they're propping up duplicate systems and unused subscriptions that happen to sit inside an acceptable percentage. A number that looks right on a spreadsheet can still hide waste the spreadsheet was never built to show.